I’m extremely pleased to announce the launch of TraceMonkey, an evolution of Firefox’s SpiderMonkey JavaScript engine for Firefox 3.1 that uses a new kind of Just-In-Time (JIT) compiler to boost JS performance by an order of magnitude or more.
Results
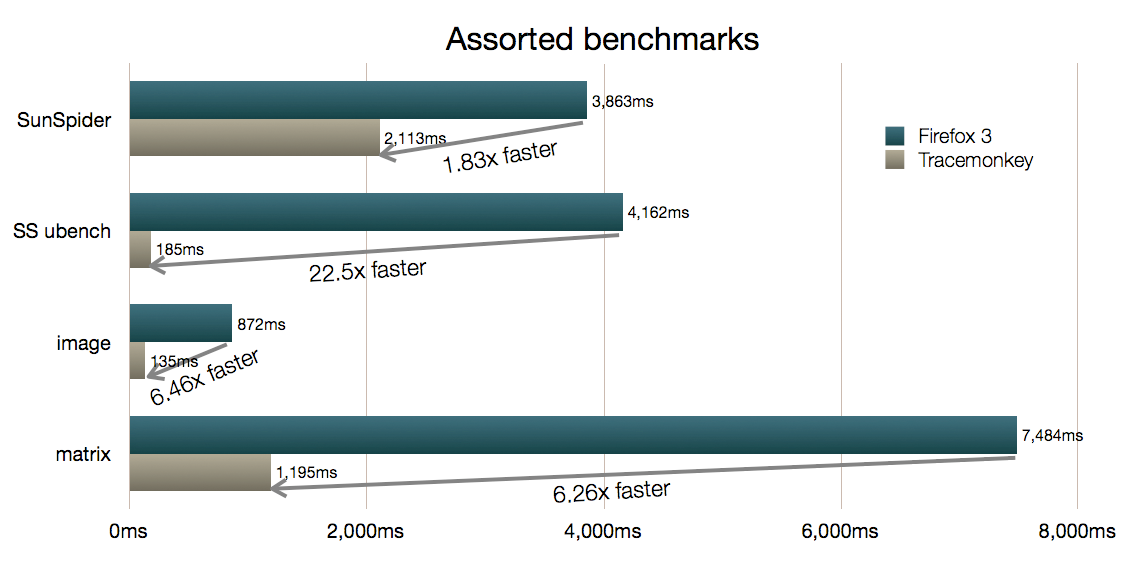
Let’s cut straight to the charts. Here are the popular SunSpider macro- and micro-benchmarks average scores, plus results for an image manipulation benchmark and a test using the Sylvester 3D JS library’s matrix multiplication methods:
Here are some select SunSpider micro-benchmarks, to show some near-term upper bounds on performance:

This chart shows speedup ratios over the SpiderMonkey interpreter, which is why “empty loop with globals” (a loop using global loop control and accumulator variables) shows a greater speedup — global variables in JavaScript, especially if undeclared by var, can be harder to optimize in an interpreter than local variables in a function.
Here are the fastest test-by-test SunSpider results, sorted from greatest speedup to least:
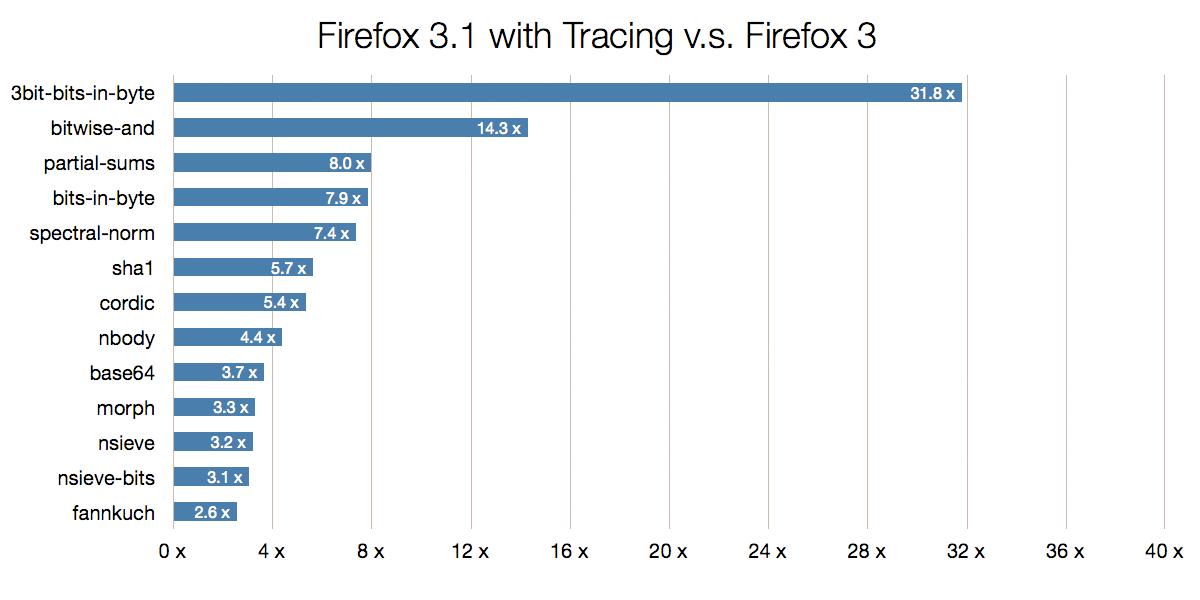
The lesser speedups need their own chart, or they would be dwarfed by the above results:
(Any slowdown is a bug we will fix; we’re in hot pursuit of the one biting binary-trees, which is heavily recursive — it will be fixed.)
With SunSpider, some of the longest-running tests are string and regular-expression monsters, and since like most JS engines, we use native (compiled C++) code for most of the work, there’s not as much speedup. Amdahl’s Law predicts that this will bound the weighted-average total Sunspider score, probably to around 2. No matter how fast we JIT the rest of the code, the total score will be . . . 2.
But this is only a start. With tracing, performance will keep going up. We have easy small linear speedup tasks remaining (better register allocation, spill reduction around built-in calls). We will trace string and regular expression code and break through the “2” barrier. We will even trace into DOM methods. The tracing JIT approach scales as you move more code into JS, or otherwise into view of the tracing machinery.
Finally, schrep created a screencast that visually demonstrates the speedup gained by TraceMonkey. These speedups are not just for micro-benchmarks. You can see and feel them.
How We Did It
We’ve been working with Andreas Gal of UC Irvine on TraceMonkey, and it has been a blast. We started a little over sixty days (and nights 😉 ago, and just yesterday, shaver pushed the results of our work into the mozilla-central Hg repository for inclusion in Firefox 3.1.
The JIT is currently pref’ed off, but you can enable it via about:config — just search for “jit” and, if you are willing to report any bugs you find, toggle the javascript.options.jit.content preference (there’s a jit.chrome pref too, for the truly adventurous).
Before TraceMonkey, for Firefox 3, we made serious performance improvements toSpiderMonkey, both to its Array code and to its interpreter. The interpreter speedups entailed two major pieces of work:
- Making bytecode cases in the threaded interpreter even fatter, so the fast cases can stay in the interpreter function.
- Adding a polymorphic property cache, for addressing properties found in prototype and scope objects quickly, without having to look in each object along the chain.
I will talk about the property cache and the “shape inference” it is based on in another post.
By the way, we are not letting moss grow under our interpreter’s feet. Dave Mandelin is working on a combination of inline-threading and call-threading that will take interpreter performance up another notch.
While doing this Firefox 3 work, I was reminded again of the adage:
Neurosis is doing the same thing over and over again, expecting to get a different result each time.
But this is exactly what dynamically typed language interpreters must do. Consider the + operator:
a = b + c;
Is this string concatenation, or number addition? Without static analysis (generally too costly), we can’t know ahead of time. For SpiderMonkey, we have to ask further: if number, can we keep the operands and result in machine integers of some kind?
Any interpreter will have to cope with unlikely (but allowed) overflow from int to double precision binary floating point, or even change of variable type from number to string. But this is neurotic, because for the vast majority of JS code, in spite of the freedom to mutate type of variable, types are stable. (This stability holds for other dynamic languages including Python.)
Another insight, which is key to the tracing JIT approach: if you are spending much time in JS, you are probably looping. There’s simply not enough straight line code in Firefox’s JS, or in a web app, to take that much runtime. Native code may go out to lunch, of course, but if you are spending time in JS, you’re either looping or doing recursion.
The Trace Trees approach to tracing JIT compilation that Andreas pioneered can handle loops and recursion. Everything starts in the interpreter, when TraceMonkey notices a hot loop by keeping cheap count of how often a particular backward jump (or any backward jump) has happened.
for (var i = 0; i < BIG; i++) {
    // Loop header starts here:
    if (usuallyTrue())
        commonPath();
    else
        uncommonPath();
}
Once a hot loop has been detected, TraceMonkey starts recording a trace. We use the Tamarin Tracing Nanojit to generate low-level intermediate representation instructions specialized from the SpiderMonkey bytecodes, their immediate and incoming stack operands, and the property cache “hit” case fast-lookup information.
The trace recorder completes when the loop header (see the comment in the code above) is reached by a backward jump. If the trace does not complete this way, the recorder aborts and the interpreter resumes without recording traces.
Let’s suppose the usuallyTrue() function returns true (it could return any truthy, e.g. 1 or "non-empty" — we can cope). The trace recorder emits a special guard instruction to check that the truthy condition matches, allowing native machine-code trace execution to continue if so. If the condition does not match, the guard exits (so-called “side-exits”) the trace, returning to the interpreter at the exact point in the bytecode where the guard was recorded, with all the necessary interpreter state restored.
If the interpreter sees usuallyTrue() return true, then the commonPath(); case will be traced. After that function has been traced comes the loop update part i++ (which might or might not stay in SpiderMonkey’s integer representation depending on the value of BIG — again we guard). Finally, the condition i < BIG will be recorded as a guard.
// Loop header starts here:
inlined usuallyTrue() call, with guards
guard on truthy return value
guard that the function being invoked at this point is commonPath
inlined commonPath() call, with any calls it makes inlined, guarded
i++ code, with overflow to double guard
i < BIG condition and loop-edge guard
jump back to loop header
Thus tracing is all about speculating that what the interpreter sees is what will happen next time — that the virtual machine can stop being neurotic. And as you can see, tracing JITs can inline method calls easily — just record the interpreter as it follows a JSOP_CALL instruction into an interpreted function.
One point about Trace Trees (as opposed to less structured kinds of tracing): you get function inlining without having to build interpreter frames at all, because the trace recording must reach the loop header in the outer function in order to complete. Therefore, so long as the JITted code stays “on trace”, no interpreter frames need to be built.
If the commonPath function itself contains a guard that side-exits at runtime, then (and only then) will one or more interpreter frames need to be reconstructed.
Let’s say after some number of iterations, the loop shown above side-exits at the guard for usuallyTrue() because that function returns a falsy value. We abort correctly back to the interpreter, but keep recording in case we can complete another trace back to the same loop header, and extend the first into a trace tree. This allows us to handle different paths through the control flow graph (including inlined functions) under a hot loop.
What It All Means
Pulling back from the details, a few points deserve to be called out:
- We have, right now, x86, x86-64, and ARM support in TraceMonkey. This means we are ready for mobile and desktop target platforms out of the box.
- As the performance keeps going up, people will write and transport code that was “too slow” to run in the browser as JS. This means the web can accommodate workloads that right now require a proprietary plugin.
- As we trace more of the DOM and our other native code, we increase the memory-safe codebase that must be trusted not to have an exploitable bug.
- Tracing follows only the hot paths, and builds a trace-tree cache. Cold code never gets traced or JITted, avoiding the memory bloat that whole-method JITs incur. Tracing is mobile-friendly.
- JS-driven <canvas> rendering, with toolkits, scene graphs, game logic, etc. all in JS, are one wave of the future that is about to crest.
TraceMonkey advances us toward the Mozilla
2 future where even more Firefox code is written in JS. Firefox gets faster and safer as this process unfolds.
I believe that other browsers will follow our lead and take JS performance through current interpreter speed barriers, using just-in-time native code compilation. Beyond what TraceMonkey means for Firefox and other Mozilla projects, it heralds the JavaScript Lightspeed future we’ve all been anticipating. We are moving the goal posts and changing the game, for the benefit of all web developers.
Acknowledgments
I would like to thank Michael Franz and the rest of his group at UC Irvine, especially Michael Bebenita, Mason Chang, and Gregor Wagner; also the National Science Foundation for supporting Andreas Gal’s thesis. I’m also grateful to Ed Smith and the Tamarin Tracing team at Adobe for the TT Nanojit, which was a huge boost to developing TraceMonkey.
And of course, mad props and late night thanks to Team TraceMonkey: Andreas, Shaver, David Anderson, with valuable assists from Bob Clary, Rob Sayre, Blake Kaplan, Boris Zbarsky, and Vladimir Vukićević.